Thou shalt not make thee any graven image, or any likeness of any thing that is in heaven above, or that is in the earth beneath, or that is in the waters beneath the earth:
(Deuteronomy 5:8) KJV
The deep, of Genesis 1:2 became the great deep, the deeps and the depths of the created world. They’re all translated from the same Hebrew word, tehom. The deep became creation. The word became flesh.
A new generation of scientific instruments has begun scouring ocean depths for temperature data, and the evidence being pinged back via satellite warns that the consequences of fossil fuel burning and deforestation are accumulating far below the planet’s surface.
More than 90 percent of the heat trapped by greenhouse gas pollution since the 1970s has wound up in the oceans, and research published Monday revealed that a little more than a third of that seafaring heat has worked its way down to depths greater than 2,300 feet (700 meters).
Plunged to ocean depths by winds and currents, that trapped heat has eluded surface temperature measurements, fueling claims of a “hiatus” or “pause” in global warming from 1998 to 2013. But by expanding cool water, the deep-sea heat’s impacts have been indirectly visible in coastal regions by pushing up sea levels, contributing to worsening high-tide flooding.
“The heat’s going in at the surface, so it’s getting down pretty deep,” said Glen Gawarkiewicz, a Woods Hole Oceanographic Institution scientist who was not involved with the study. “With 35 percent of the heat uptake going below 700 meters, it really points out the importance of continued deep ocean sampling. It was a surprise to me that it was that large of a fraction.”
The research, published in Nature Climate Change, was led by Lawrence Livermore National Laboratory. It compared modeling results with data from a mishmash of sources, most notably from a nascent fleet of monitoring devices called deep Argo floats.
The researchers concluded that half of overall ocean warming has occurred since 1997—a date that they noted in their paper was “nearly coincident with the beginning of the observed surface warming hiatus.”
Percentage of global ocean heat content change
A combination of climate pollution, a recent change in a long-running cycle of the Pacific Ocean and the current El Niño has led to a spike in warming rates recorded at the surface of the planet. That followed a surface warming slowdown; 2014 and 2015 were the warmest years on record globally.
Research groups from around the world have deployed thousands of Argo floats to measure since around the year 2000 to take temperature, salinity and other measurements. Technological advances have allowed a small fleet of deeper-diving floats to be deployed more recently. Some of those have been built to dive as deep as 20,000 feet.
“Knowing how much the ocean is warming and how fast and where are all important for knowing how much the atmosphere is going to warm and how much seas are going to rise,” said Gregory C. Johnson, a National Oceanic and Atmospheric Administration scientist who works on that agency’s Argo float program.
Monday’s paper used the new deep-sea Argo data to expand on a paper published in 2014 by Lawrence Livermore and other researchers, which revealed high levels of warming in the ocean’s surface layer.
“The oceans as an energy store are really doing a lot of the work,” said Lawrence Livermore researcher Paul Durack, who helped produce the studies that were published Monday and in 2014. “The actual temperature change is relatively small, but due to the huge heat capacity of the oceans this equates to a very, very large heat content change.”
The extent of sea ice surrounding the Arctic and Antarctic regions are both at record lows for this time of year — marking the first time scientists have simultaneously tracked record low ice levels around each of the planet’s poles.
Scientists say the below-normal sea ice extent — a rough measurement of the surface area of ice-covered ocean — in the Arctic is particularly worrisome because it is a strong indication of the effects of climate change.
Experts said they were also shocked by the decrease in sea ice in the Antarctic, but were not as concerned by that development.
The Arctic
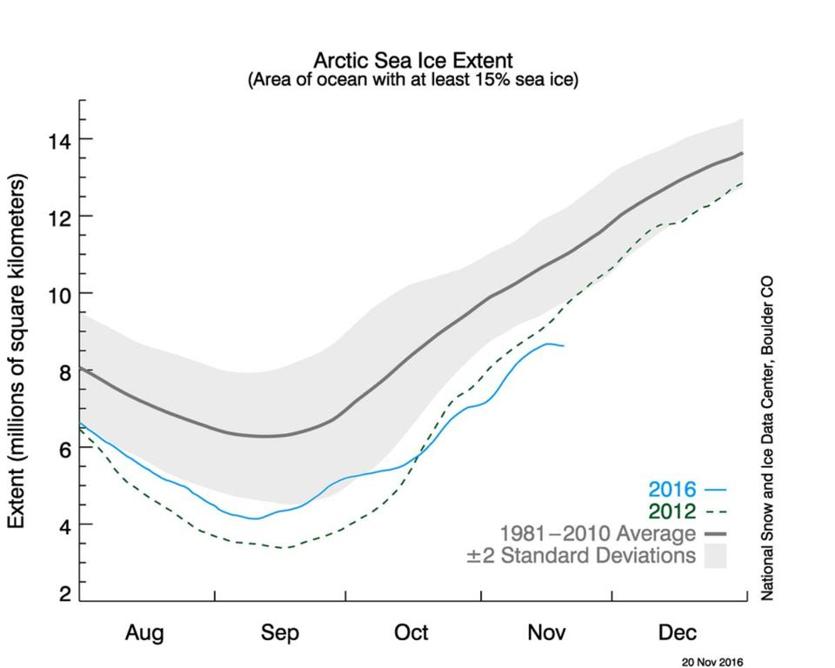
In the Arctic, sea ice extent measured 8.625 million square kilometers, as of Nov. 20, according to data from the National Snow & Ice Data Center, which measures sea ice extent as areas of ocean being covered by at least 15 percent sea ice.
The previous record low at that point in the year, based on satellite records dating back to 1979, was 9.632 million square kilometers in 2012.
Arctic Sea Ice Extent
Around this time of year, the sea ice extent in the Arctic is normally increasing as wintry conditions start to set in. But in the last several days the seasonal growth of sea ice there hascome to a near halt due to above-normal temperatures there that experts said they believed to be caused by warmer-than-usual ocean temperatures left over from the summer and winds from the south driving warmer air into the region.
Claire Parkinson, a climatologist at NASA’s Goddard Space Flight Center, said that above-average temperatures and below-normal sea ice extents in the Arctic, while concerning especially for the longterm, are not entirely surprising.
“The Arctic has been decreasing for many years now in terms of overall trend,” she said.
Since 1979, winter Arctic ice extent has decreased by about 3 percent per decade, records show.
“The Arctic is kind of a nothing new here story — what’s going on now is extreme and a record low — but we’ve seen record lows in the past couple of decades,” said Walt Meier, a scientist from the Goddard center’s Cryospheric Sciences Laboratory.
But “from a climate perspective, the Arctic changes are much more significant,” he said.
The years of diminishing sea ice extent has been caused by temperature increases scientists have attributed to greenhouse gas emissions from humans.
The shrinking sea ice extent is problematic because ice cover in the Earth’s cool polar regions — particularly the Arctic which maintains much more ice through the summer months — help moderate global temperatures.
“It acts as a refrigerator or cooler for the planet, if you will,” Meier said.
Sea ice has a bright surface that reflects about 80 percent of the sunlight that strikes it, helping to maintain cool temperatures. When that ice is lost, it exposes a dark ocean surface, which has the opposite effect absorbing about 90 percent of sunlight causing both sea and air temperatures to warm.
Melting sea ice does not cause sea levels to rise — melting land ice causes that. But because melting sea ice leads to warmer temperatures, it indirectly contributes to sea level rise that’s threatening coastal communities around the planet.
The Antarctic
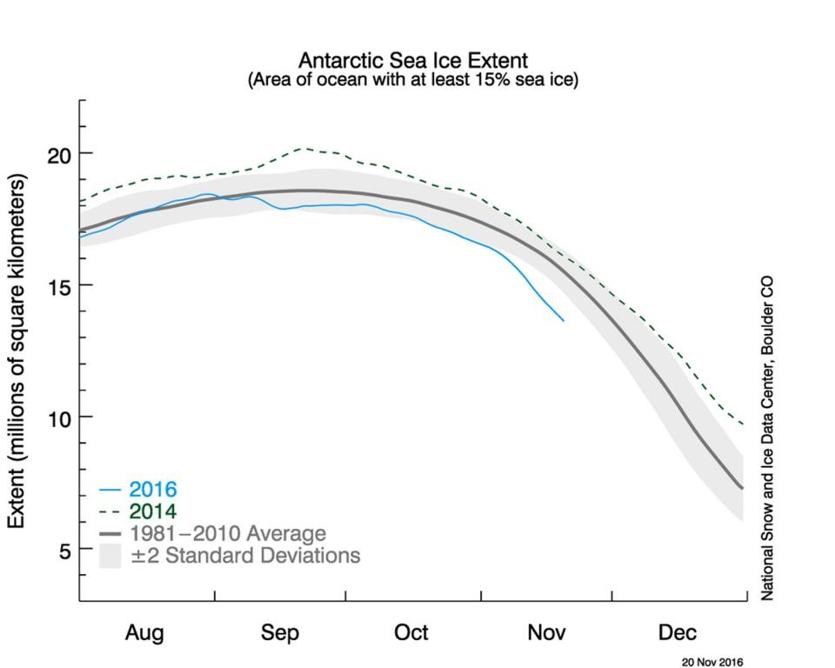
The sea ice extent in the Antarctic covered 13.616 million square kilometers, as of Nov. 20, data show.
The previous record low sea ice extent at that point in the year was 14.7 million square kilometers in 1986.
Antarctic Sea Ice Extent
In the Antarctic, the sea ice extent there is normally shrinking around this time of year as summer starts to set in. But this year, the drop in sea ice coverage has been much more dramatic.
“It’s been quite striking,” said Parkinson.
The trend is also a remarkable reversal from what had been going on in the Antarctic.
The sea ice extent in the Antarctic had actually risen in recent years, even hitting record highs in 2014.
Something threw that trend off course recently.
“It’s a little mysterious,” said Meier.
Both he and Parkinson noted the Antarctic is much more prone to large swings in sea ice extent than the Arctic. And they said they suspected the sudden shift happening now is being caused primarily by weather conditions and patterns.
It would be unlikely that a more worrisome potential cause — climate change — could explain all of the recent, sharp and sudden decline in Antarctic sea ice.
But experts said they expect the Antarctic’s sea ice extent will eventually start to lose sea ice extent due to global warming, albeit more gradually.
Even though sea ice extent had increased there in recent years, scientists believe that climate change has been affecting the Antarctic. But various factors in that region have managed to largely cancel out the warming, including the Antarctic’s geography, geometry, and wind and ocean currents that somewhat insulate the region to global weather patterns.
“It’s expected that, eventually, warming will catch up and become a significant player in the Antarctic,” Meier said.
Scientists also noted that losses in Arctic ice extent in recent years have far exceeded the gains in Antarctic ice extent.
Does it matter that both poles are seeing historic lows in sea ice extent at the same time?
Not really.
“The fact that they are both record lows is interesting, but from a climate perspective, it may not mean that much,” Meier said. ”It may simply be coincidence or chance in some sense.”
Editor’s note: The following web story was provided by Lawrence Livermore National Laboratory. The original story can be found by clicking here on the Lawrence Livermore website.
Lawrence Livermore National Laboratory scientists, working with National Oceanic and Atmospheric Administration and university colleagues, have found that half of the global ocean heat content increase since 1865 has occurred over the past two decades.
“In recent decades the ocean has continued to warm substantially, and with time the warming signal is reaching deeper into the ocean,” said LLNL scientist Peter Gleckler, lead author of a paper published in the journal Nature Climate Change.
Changes in ocean heat storage are important because the ocean absorbs more than 90 percent of the Earth’s excess heat increase that is associated with global warming. The observed ocean and atmosphere warming is a result of continuing greenhouse gas emissions. Quantifying how much heat is accumulating in the Earth system is critical to improving the understanding of climate change already under way and to better assess how much more to expect in decades and centuries to come. It is vital to improving projections of how much and how fast the Earth will warm and seas rise in the future.
Increases in upper ocean temperatures since the 1970s are well documented and associated with greenhouse gas emissions. By including measurements from a 19th century oceanographic expedition and recent changes in the deeper ocean, the study indicates that half of the accumulated heat during the industrial era has occurred in recent decades, with about a third residing in the deeper oceans.
The team analyzed a diverse set of ocean temperature observations and a large suite of climate models. Scientists have measured ocean temperatures in a variety of ways over time, from lowering pairs of minimum-maximum thermometers to different depths on lines dangled overboard during the H.M.S. Challenger 1872-1876 expedition, to use of highly accurate modern instruments placed on robotic profiling floats (called Argo) that “phone home” the data using satellites, starting around 1999.
This study found that ocean warming estimates over a range of times and depths agree well with results from the latest generation of climate models, building confidence that the climate models are providing useful information. “The year-round, global distribution of ocean temperature data collected by Argo has been key in improving our estimates of ocean warming and assessing climate models,” notes LLNL oceanographer Paul Durack.
While Argo only samples the upper half of the ocean volume, pilot arrays of new “Deep Argo” floats that sample to the ocean floor are being deployed. This vast ocean volume in the deeper half is only measured infrequently by research vessels. Those deep data also show warming, even in the bottom layers of the ocean in recent decades. “Given the importance of the ocean warming signal for understanding our changing climate, it is high time to measure the global ocean systematically from the surface to the ocean floor,” said NOAA oceanographer Gregory Johnson.
Other authors include NOAA climate modeler Ronald Stouffer and Penn State Climate Scientist Chris Forest. The study was conducted as part of the Climate Research Program at Lawrence Livermore National Laboratory through the Program for Climate Model Diagnosis and Intercomparison, which is funded by the Department of Energy’s Regional and Global Climate Modeling Program. The NOAA contribution was supported by NOAA’s Office of Oceanic and Atmospheric Research. Work at Penn State was partially supported by the Department of Energy, Office of Science, Office of Biological and Environmental Research and by the National Science Foundation through the Network for Sustainable Climate Risk Management (SCRiM).
The Earth’s climate has changed throughout history. Just in the last 650,000 years there have been seven cycles of glacial advance and retreat, with the abrupt end of the last ice age about 7,000 years ago marking the beginning of the modern climate era — and of human civilization. Most of these climate changes are attributed to very small variations in Earth’s orbit that change the amount of solar energy our planet receives.
Scientific evidence for warming of the climate system is unequivocal.
– Intergovernmental Panel on Climate Change
The current warming trend is of particular significance because most of it is extremely likely (greater than 95 percent probability) to be the result of human activity since the mid-20th century and proceeding at a rate that is unprecedented over decades to millennia.1
Earth-orbiting satellites and other technological advances have enabled scientists to see the big picture, collecting many different types of information about our planet and its climate on a global scale. This body of data, collected over many years, reveals the signals of a changing climate.
The heat-trapping nature of carbon dioxide and other gases was demonstrated in the mid-19th century.2 Their ability to affect the transfer of infrared energy through the atmosphere is the scientific basis of many instruments flown by NASA. There is no question that increased levels of greenhouse gases must cause the Earth to warm in response.
Ice cores drawn from Greenland, Antarctica, and tropical mountain glaciers show that the Earth’s climate responds to changes in greenhouse gas levels. Ancient evidence can also be found in tree rings, ocean sediments, coral reefs, and layers of sedimentary rocks. This ancient, or paleoclimate, evidence reveals that current warming is occurring roughly ten times faster than the average rate of ice-age-recovery warming.3
Here the article provides links to various types of evidence that are used to support the idea of climate change.
Wow, was this a bad year for those who deny the reality and the significance of human-induced climate change. Of course, there were the recent flurry of reports that 2014 surface temperatures had hit their hottest values ever recorded. The 2014 record was first called on this blog in December and the final results were reported as well, here. All of this happened in a year that the denialists told us would not be very hot.
But those denialists are having a tough time now as they look around the planet for ANY evidence that climate change is not happening. The problem is, they’ve been striking out.
And just recently, perhaps the most important bit of information came out about 2014 – how much the Earth actually warmed. What we find is that the warming is so great, NOAA literally has to remake its graphs. Let me explain this a bit.
We tend to focus on the global temperature average which is the average of air temperatures near the ground (or at the sea surface). This past year, global air temperatures were record-breaking. But that isn’t the same as global warming. Global warming is properly viewed as the amount of heat contained within the Earth’s energy system. So, air temperatures may go up and down on any given year as energy moves to or from the air (primarily from the ocean). What we really want to know is, did the Earth’s energy go up or down?
The trick to answering this question is to measure the change in energy of the oceans. A thorough review of ocean heat measurement methods is found here; we paid the requisite fee to make the paper open access. Anyone can download and read it.
So what do the new data show? Well, it turns out that the energy stored within the ocean (which is 90% or more of the total “global warming” heat), increased significantly. A plot from NOAA is shown above. You can see that the last data point (the red curve), is, literally off the chart.
The folks at NOAA do a great job updating this graph every three months or so. We can now say that the 2014 Earth had more heat (thermal energy) than any year ever recorded by humans. We can also say that the folks at NOAA will likely have to rescale their graph to capture the new numbers. The NOAA site is updated by Dr. Tim Boyer and can be found here. Click on slide 2 to view the relevant image.
If people want to read a review of ocean heating that is written for a general audience, I suggest our recent peer-reviewed paper which can be found here.
So when we look back on 2014 and the records that fell, it gives us some pause about the so-called pause (hat-tip to Dr. Greg Laden for that phrase). Some people tried to tell us global warming had “paused”, that it ended in 1998, or that the past 15 years or so had not seen a change in the energy of the Earth. This ocean warming data is the clearest nail in that coffin. There never was a pause to global warming, there never was a halt, and the folks that tried to tell you there was were, well, I’ll let you decide. For me, the facts speak for themselves.
And God created great whales, and every living creature that moveth, which the waters brought forth abundantly, after their kind, and every winged fowl after his kind: and God saw that it was good.
(Genesis 1:21) KJV
Where’s the evidence of a world-wide flood? It’s world-wide. We refer to it as the stratigraphic column, sedimentary deposits which were deposited all over the world during the year-long event of Noah’s flood.
Freshening and warming of Antarctic Bottom Water (AABW) between the 1980s and 2000s are quantified, assessing the relative contributions of water-mass changes and isotherm heave. The analysis uses highly accurate, full-depth, ship-based, conductivity–temperature–depth measurements taken along repeated oceanographic sections around the Southern Ocean. Fresher varieties of AABW are present within the South Pacific and south Indian Oceans in the 2000s compared to the 1990s, with the strongest freshening in the newest waters adjacent to the Antarctic continental slope and rise indicating a recent shift in the salinity of AABW produced in this region. Bottom waters in the Weddell Sea exhibit significantly less water-mass freshening than those in the other two southern basins. However, a decrease in the volume of the coldest, deepest waters is observed throughout the entire Southern Ocean. This isotherm heave causes a salinification and warming on isobaths from the bottom up to the shallow potential temperature maximum. The water-mass freshening of AABW in the Indian and Pacific Ocean sectors is equivalent to a freshwater flux of 73 ± 26 Gt yr−1, roughly half of the estimated recent mass loss of the West Antarctic Ice Sheet. Isotherm heave integrated below 2000 m and south of 30°S equates to a net heat uptake of 34 ± 14 TW of excess energy entering the deep ocean from deep volume loss of AABW and 0.37 ± 0.15 mm yr−1 of sea level rise from associated thermal expansion.
When I tell people that ocean water is warming from the bottom up a common response that I get is:
“Do you mean that the hottest waters are at the bottom?”
This is a great illustration of the intellectual bankruptcy of atheism. Atheists can’t comprehend simple logic, and one of the ways that they cope with it is to instinctively warp whatever you said into something that they can understand. Since atheists automatically assume that everyone who disagrees with them is idiotic, they intentionally misinterpret whatever you said into something idiotic.
My response is simple enough:
Water warms at the bottom, as this happens the water is displaced upward by colder water.
The article appears to confirm this. Bottom water is freshening because of an influx of water from melting polar ice. This is also driving ocean circulation.
This is a direct copy of a SciPop or news article preserved here because things on the internet have a bad habit of disappearing when you try to find them again. Full credit is given to the original authors and the source.
– Matty
Ocean Temperature
Warmer oceans put coastal communities at risk, increase infrastructure costs, endanger polar creatures and threaten coral reefs and fisheries. Perhaps most alarmingly, rising ocean temperatures accelerate the overall warming trend.
This is a direct copy of a SciPop or news article preserved here because things on the internet have a bad habit of disappearing when you try to find them again. Full credit is given to the original authors and the source.
The oceans are the flywheel of the climate system. As atmospheric concentrations of greenhouse gases increase, the Earth system is warming, and over 90 percent of that increase in heat goes into the ocean. Knowing how much heat the ocean absorbs is vital to understanding sea level rise (the oceans expand as they warm), and predicting how much, and how fast, the atmosphere will warm.